Thursday, March 15, 2018

Flowchart

A flowchart is a type of diagram that represents an algorithm, workflow or process, showing the steps as boxes of various kinds, and their order by connecting them with arrows. This diagrammatic representation illustrates a solution model to a given problem. Flowcharts are used in analyzing, designing, documenting or managing a process or program in various fields.[1]

Contents

Overview

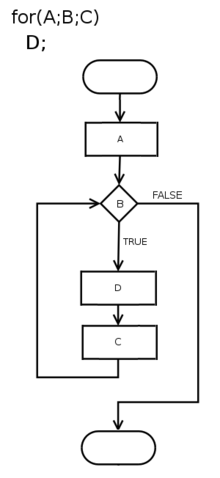
Flowchart of a for loop
Flowcharts are used in designing and documenting simple processes or programs. Like other types of diagrams, they help visualize what is going on and thereby help understand a process, and perhaps also find flaws, bottlenecks, and other less-obvious features within it. There are many different types of flowcharts, and each type has its own repertoire of boxes and notational conventions. The two most common types of boxes in a flowchart are:
  • a processing step, usually called activity, and denoted as a rectangular box
  • a decision, usually denoted as a diamond.
A flowchart is described as "cross-functional" when the page is divided into different swimlanes describing the control of different organizational units. A symbol appearing in a particular "lane" is within the control of that organizational unit. This technique allows the author to locate the responsibility for performing an action or making a decision correctly, showing the responsibility of each organizational unit for different parts of a single process.
Flowcharts depict certain aspects of processes and are usually complemented by other types of diagram. For instance, Kaoru Ishikawa defined the flowchart as one of the seven basic tools of quality control, next to the histogram, Pareto chart, check sheet, control chart, cause-and-effect diagram, and the scatter diagram. Similarly, in UML, a standard concept-modeling notation used in software development, the activity diagram, which is a type of flowchart, is just one of many different diagram types.
Nassi-Shneiderman diagrams and Drakon-charts are an alternative notation for process flow.
Common alternative names include: flow chart, process flowchart, functional flowchart, process map, process chart, functional process chart, business process model, process model, process flow diagram, work flow diagram, business flow diagram. The terms "flowchart" and "flow chart" are used interchangeably.
The underlying graph structure of a flowchart is a flow graph, which abstracts away node types, their contents and other ancillary information.

History

The first structured method for documenting process flow, the "flow process chart", was introduced by Frank and Lillian Gilbreth to members of the American Society of Mechanical Engineers (ASME) in 1921 in the presentation "Process Charts: First Steps in Finding the One Best Way to do Work".[2] The Gilbreths' tools quickly found their way into industrial engineering curricula. In the early 1930s, an industrial engineer, Allan H. Mogensen began training business people in the use of some of the tools of industrial engineering at his Work Simplification Conferences in Lake Placid, New York.
A 1944 graduate of Mogensen's class, Art Spinanger, took the tools back to Procter and Gamble where he developed their Deliberate Methods Change Program. Another 1944 graduate, Ben S. Graham, Director of Formcraft Engineering at Standard Register Industrial, adapted the flow process chart to information processing with his development of the multi-flow process chart to display multiple documents and their relationships.[3] In 1947, ASME adopted a symbol set derived from Gilbreth's original work as the "ASME Standard: Operation and Flow Process Charts."[4]
Douglas Hartree in 1949 explained that Herman Goldstine and John von Neumann had developed a flowchart (originally, diagram) to plan computer programs.[5] His contemporary account is endorsed by IBM engineers[6] and by Goldstine's personal recollections.[7] The original programming flowcharts of Goldstine and von Neumann can be seen in their unpublished report, "Planning and coding of problems for an electronic computing instrument, Part II, Volume 1" (1947), which is reproduced in von Neumann's collected works.[8]
Flowcharts became a popular means for describing computer algorithms. The popularity of flowcharts decreased in the 1970s when interactive computer terminals and third-generation programming languages became common tools for computer programming. Algorithms can be expressed much more concisely as source code in such languages. Often pseudo-code is used, which uses the common idioms of such languages without strictly adhering to the details of a particular one.
Nowadays flowcharts are still used for describing computer algorithms.[9] Modern techniques such as UML activity diagrams and Drakon-charts can be considered to be extensions of the flowchart.

Types

Sterneckert (2003) suggested that flowcharts can be modeled from the perspective of different user groups (such as managers, system analysts and clerks) and that there are four general types:[10]
  • Document flowcharts, showing controls over a document-flow through a system
  • Data flowcharts, showing controls over a data-flow in a system
  • System flowcharts, showing controls at a physical or resource level
  • Program flowchart, showing the controls in a program within a system
Notice that every type of flowchart focuses on some kind of control, rather than on the particular flow itself.[10]
However, there are several of these classifications. For example, Andrew Veronis (1978) named three basic types of flowcharts: the system flowchart, the general flowchart, and the detailed flowchart.[11] That same year Marilyn Bohl (1978) stated "in practice, two kinds of flowcharts are used in solution planning: system flowcharts and program flowcharts...".[12] More recently Mark A. Fryman (2001) stated that there are more differences: "Decision flowcharts, logic flowcharts, systems flowcharts, product flowcharts, and process flowcharts are just a few of the different types of flowcharts that are used in business and government".[13]
In addition, many diagram techniques exist that are similar to flowcharts but carry a different name, such as UML activity diagrams.

Building blocks

Common symbols

The American National Standards Institute (ANSI) set standards for flowcharts and their symbols in the 1960s.[14] The International Organization for Standardization (ISO) adopted the ANSI symbols in 1970.[15] The current standard was revised in 1985.[16] Generally, flowcharts flow from top to bottom and left to right.[17]
ANSI/ISO Shape Name Description
Flowchart Line.svg Flowline (Arrowhead)[15] Shows the program's order of operation. A line coming from one symbol and ending at another.[14] Arrowheads are added if the flow is not the standard top-to-bottom, left-to right.[15]
Flowchart Terminal.svg Terminal[14] Beginning or ending of a program or sub-process. Represented as a stadium,[14] oval or rounded (fillet) rectangle. They usually contain the word "Start" or "End", or another phrase signaling the start or end of a process, such as "submit inquiry" or "receive product".
Flowchart Process.svg Process[15] Set of operations that change value, form, or location of data. Represented as a rectangle.[15]
Flowchart Decision.svg Decision[15] Conditional operation determining which of two paths the program will take.[14] The operation is commonly a yes/no question or true/false test. Represented as a diamond (rhombus).[15]
Flowchart IO.svg Input/Output[15] Input and output of data,[15] as in entering data or displaying results. Represented as a parallelogram.[14]
Flowchart Annotation.svg Annotation[14] (Comment)[15] Additional information about a step the program. Represented as an open rectangle with a dashed or solid line connecting it to the corresponding symbol in the flowchart.[15]
Flowchart Predefined Process.svg Predefined Process[14] Named process which is defined elsewhere. Represented as a rectangle with double-struck vertical edges.[14]
Flowchart Connector.svg On-page Connector[14] Pairs of labeled connectors replace long or confusing lines on a flowchart page. Represented by a small circle with a letter inside.[14][18]
Off page connector.png Off-page Connector[14] A labeled connector for use when the target is on another page. Represented as a home plate-shaped pentagon.[14][18]

Other symbols

The ANSI/ISO standards include symbols beyond the basic shapes. Some are:[17][18]
  • Data File or Database represented by a cylinder (disk drive).
  • Document represented as a rectangle with a wavy base.
  • Manual input represented by quadrilateral, with the top irregularly sloping up from left to right like the side view of a keyboard.
  • Manual operation represented by a trapezoid with the longest parallel side at the top, to represent an operation or adjustment to process that can only be made manually.
  • Parallel Mode represented by two horizontal lines at the beginning or ending of simultaneous operations[17]
  • Preparation or Initialization represented by an elongated hexagon, originally used for steps like setting a switch or initializing a routine.
For parallel and concurrent processing the Parallel Mode horizontal lines[19] or a horizontal bar[20] indicate the start or end of a section of processes that can be done independently:
  • At a fork, the process creates one or more additional processes, indicated by a bar with one incoming path and two or more outgoing paths.
  • At a join, two or more processes continue as a single process, indicated by a bar with several incoming paths and one outgoing path. All processes must complete before the single process continues.[20]

Software

Diagramming

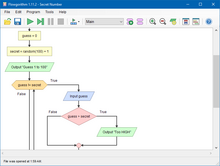
Flowgorithm
Any drawing program can be used to create flowchart diagrams, but these will have no underlying data model to share data with databases or other programs such as project management systems or spreadsheet. Some tools such as yEd, Inkscape and Microsoft Visio offer special support for flowchart drawing. Many software packages exist that can create flowcharts automatically, either directly from a programming language source code, or from a flowchart description language.
There are several applications and visual programming languages[21] that use flowcharts to represent and execute programs. Generally these are used as teaching tools for beginner students. Examples include Flowgorithm, Raptor. LARP, Visual Logic, and VisiRule.
Software design

Software design is the process by which an agent creates a specification of a software artifact, intended to accomplish goals, using a set of primitive components and subject to constraints.[1] Software design may refer to either "all the activity involved in conceptualizing, framing, implementing, commissioning, and ultimately modifying complex systems" or "the activity following requirements specification and before programming, as ... [in] a stylized software engineering process."[2]
Software design usually involves problem solving and planning a software solution. This includes both a low-level component and algorithm design and a high-level, architecture design.

Contents

Overview

Software design is the process of implementing software solutions to one or more sets of problems. One of the main components of software design is the software requirements analysis (SRA). SRA is a part of the software development process that lists specifications used in software engineering. If the software is "semi-automated" or user centered, software design may involve user experience design yielding a storyboard to help determine those specifications. If the software is completely automated (meaning no user or user interface), a software design may be as simple as a flow chart or text describing a planned sequence of events. There are also semi-standard methods like Unified Modeling Language and Fundamental modeling concepts. In either case, some documentation of the plan is usually the product of the design. Furthermore, a software design may be platform-independent or platform-specific, depending upon the availability of the technology used for the design.
The main difference between software analysis and design is that the output of a software analysis consists of smaller problems to solve. Additionally, the analysis should not be designed very differently across different team members or groups. In contrast, the design focuses on capabilities, and thus multiple designs for the same problem can and will exist. Depending on the environment, the design often varies, whether it is created from reliable frameworks or implemented with suitable design patterns. Design examples include operation systems, webpages, mobile devices or even the new cloud computing paradigm.
Software design is both a process and a model. The design process is a sequence of steps that enables the designer to describe all aspects of the software for building. Creative skill, past experience, a sense of what makes "good" software, and an overall commitment to quality are examples of critical success factors for a competent design. It is important to note, however, that the design process is not always a straightforward procedure; the design model can be compared to an architect’s plans for a house. It begins by representing the totality of the thing that is to be built (e.g., a three-dimensional rendering of the house); slowly, the thing is refined to provide guidance for constructing each detail (e.g., the plumbing lay). Similarly, the design model that is created for software provides a variety of different views of the computer software. Basic design principles enable the software engineer to navigate the design process. Davis [DAV95][full citation needed] suggests a set of principles for software design, which have been adapted and extended in the following list:
  • The design process should not suffer from "tunnel vision." A good designer should consider alternative approaches, judging each based on the requirements of the problem, the resources available to do the job.
  • The design should be traceable to the analysis model. Because a single element of the design model can often be traced back to multiple requirements, it is necessary to have a means for tracking how requirements have been satisfied by the design model.
  • The design should not reinvent the wheel. Systems are constructed using a set of design patterns, many of which have likely been encountered before. These patterns should always be chosen as an alternative to reinvention. Time is short and resources are limited; design time should be invested in representing (truly new) ideas by integrating patterns that already exist (when applicable).
  • The design should "minimize the intellectual distance" between the software and the problem as it exists in the real world. That is, the structure of the software design should, whenever possible, mimic the structure of the problem domain.
  • The design should exhibit uniformity and integration. A design is uniform if it appears fully coherent. In order to achieve this outcome, rules of style and format should be defined for a design team before design work begins. A design is integrated if care is taken in defining interfaces between design components.
  • The design should be structured to accommodate change. The design concepts discussed in the next section enable a design to achieve this principle.
  • The design should be structured to degrade gently, even when aberrant data, events, or operating conditions are encountered. Well- designed software should never "bomb"; it should be designed to accommodate unusual circumstances, and if it must terminate processing, it should do so in a graceful manner.
  • Design is not coding, coding is not design. Even when detailed procedural designs are created for program components, the level of abstraction of the design model is higher than the source code. The only design decisions made at the coding level should address the small implementation details that enable the procedural design to be coded.
  • The design should be assessed for quality as it is being created, not after the fact. A variety of design concepts and design measures are available to assist the designer in assessing quality throughout the development process.
  • The design should be reviewed to minimize conceptual (semantic) errors. There is sometimes a tendency to focus on minutiae when the design is reviewed, missing the forest for the trees. A design team should ensure that major conceptual elements of the design (omissions, ambiguity, inconsistency) have been addressed before worrying about the syntax of the design model.

Design Concepts

The design concepts provide the software designer with a foundation from which more sophisticated methods can be applied. A set of fundamental design concepts has evolved. They are as follows:
  1. Abstraction - Abstraction is the process or result of generalization by reducing the information content of a concept or an observable phenomenon, typically in order to retain only information which is relevant for a particular purpose.It is an act of Representing essential features without including the background details or explanations.
  2. Refinement - It is the process of elaboration. A hierarchy is developed by decomposing a macroscopic statement of function in a step-wise fashion until programming language statements are reached. In each step, one or several instructions of a given program are decomposed into more detailed instructions. Abstraction and Refinement are complementary concepts.
  3. Modularity - Software architecture is divided into components called modules.
  4. Software Architecture - It refers to the overall structure of the software and the ways in which that structure provides conceptual integrity for a system. Good software architecture will yield a good return on investment with respect to the desired outcome of the project, e.g. in terms of performance, quality, schedule and cost.
  5. Control Hierarchy - A program structure that represents the organization of a program component and implies a hierarchy of control.
  6. Structural Partitioning - The program structure can be divided both horizontally and vertically. Horizontal partitions define separate branches of modular hierarchy for each major program function. Vertical partitioning suggests that control and work should be distributed top down in the program structure.
  7. Data Structure - It is a representation of the logical relationship among individual elements of data.
  8. Software Procedure - It focuses on the processing of each module individually.
  9. Information Hiding - Modules should be specified and designed so that information contained within a module is inaccessible to other modules that have no need for such information.
In his object model, Grady Booch mentions Abstraction, Encapsulation, Modularisation, and Hierarchy as fundamental software design principles.[3] The acronym PHAME (Principles of Hierarchy, Abstraction, Modularisation, and Encapsulation) is sometimes used to refer to these four fundamental principles.[4]

Design considerations

There are many aspects to consider in the design of a piece of software. The importance of each consideration should reflect the goals and expectations that the software is being created to meet. Some of these aspects are:
  • Compatibility - The software is able to operate with other products that are designed for interoperability with another product. For example, a piece of software may be backward-compatible with an older version of itself.
  • Extensibility - New capabilities can be added to the software without major changes to the underlying architecture.
  • Modularity - the resulting software comprises well defined, independent components which leads to better maintainability. The components could be then implemented and tested in isolation before being integrated to form a desired software system. This allows division of work in a software development project.
  • Fault-tolerance - The software is resistant to and able to recover from component failure.
  • Maintainability - A measure of how easily bug fixes or functional modifications can be accomplished. High maintainability can be the product of modularity and extensibility.
  • Reliability (Software durability) - The software is able to perform a required function under stated conditions for a specified period of time.
  • Reusability - The ability to use some or all of the aspects of the preexisting software in other projects with little to no modification.
  • Robustness - The software is able to operate under stress or tolerate unpredictable or invalid input. For example, it can be designed with resilience to low memory conditions.
  • Security - The software is able to withstand and resist hostile acts and influences.
  • Usability - The software user interface must be usable for its target user/audience. Default values for the parameters must be chosen so that they are a good choice for the majority of the users.[5]
  • Performance - The software performs its tasks within a time-frame that is acceptable for the user, and does not require too much memory.
  • Portability - The software should be usable across a number of different conditions and environments.
  • Scalability - The software adapts well to increasing data or number of users.

Modeling language

A modeling language is any artificial language that can be used to express information, knowledge or systems in a structure that is defined by a consistent set of rules. These rules are used for interpretation of the components within the structure. A modeling language can be graphical or textual. Examples of graphical modeling languages for software design are:

Design patterns

A software designer or architect may identify a design problem which has been visited and perhaps even solved by others in the past. A template or pattern describing a solution to a common problem is known as a design pattern. The reuse of such patterns can help speed up the software development process.[7]

Technique

The difficulty of using the term "design" in relation to software is that in some senses, the source code of a program is the design for the program that it produces. To the extent that this is true, "software design" refers to the design of the design. Edsger W. Dijkstra referred to this layering of semantic levels as the "radical novelty" of computer programming,[8] and Donald Knuth used his experience writing TeX to describe the futility of attempting to design a program prior to implementing it:
TEX would have been a complete failure if I had merely specified it and not participated fully in its initial implementation. The process of implementation constantly led me to unanticipated questions and to new insights about how the original specifications could be improved.[9]

Usage

Software design documentation may be reviewed or presented to allow constraints, specifications and even requirements to be adjusted prior to computer programming. Redesign may occur after review of a programmed simulation or prototype. It is possible to design software in the process of programming, without a plan or requirement analysis,[10] but for more complex projects this would not be considered feasible. A separate design prior to programming allows for multidisciplinary designers and Subject Matter Experts (SMEs) to collaborate with highly skilled programmers for software that is both useful and technically sound.